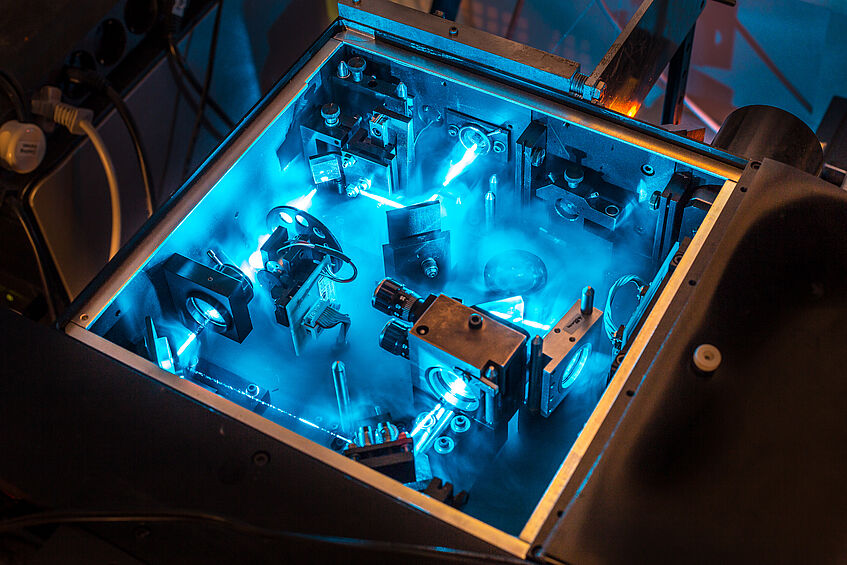
Spectrometer
The picture shows partially the interior of a spectrometer where laser light is guided through a system of mirrors and filters to a carbon nanotube sample underneath a microscope, so that every other light source is cut off and the response of the carbon nanotubes to this very specific wavelength / frequency can be recorded with high accuracy.
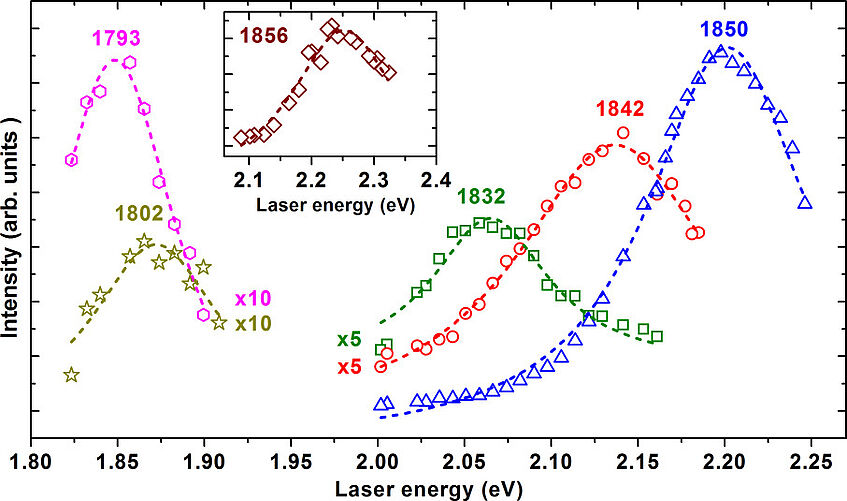
Band gaps
Carbyne has optical properties that depend on the length of the carbon chains. The numbers above the curves stand for the respective vibrational frequency, correlated to the length of the carbon chains as these are bombarded with laser light. Not only do longer chains exhibit a lower frequency, we also found that the longest chains require a lower laser energy.
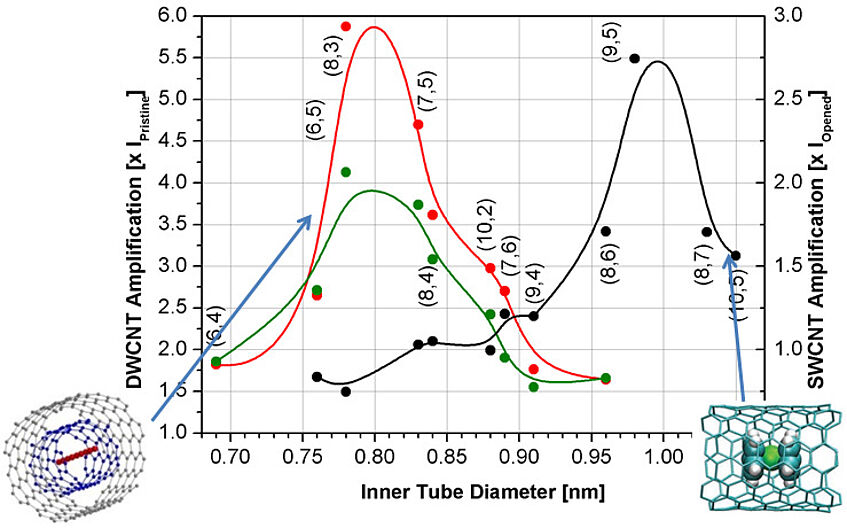
Luminescence
The fluorescence intensity of carbon nanotubes can be improved, on the left (red and green) by filling with carbyne, on the right (black) with a molecule called ferrocene. As these molecules have different sizes, differently thick nanotubes are affected differently by the interaction between host and molecule.
Chain growth (movie)
The movie shows a simulation of the growth of carbon chains within a carbon nanotube, which is performed by a high temperature treatment. By applying adequate temperatures, smaller chains start moving along the nanotube axis to eventually coalesce with other small chains to a larger chain.
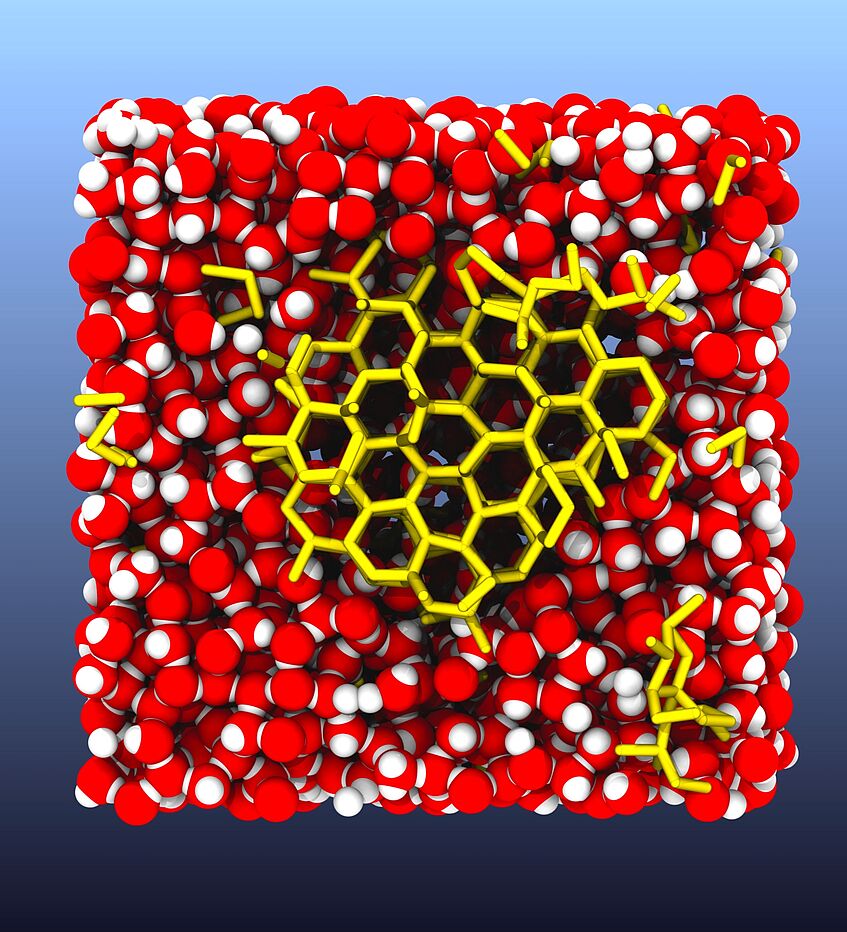
Freezing ice
The water is cooled below its freezing point, water molecules arrange in an open lattice structure, forming an ice nucleus (yellow sticks). This picture is taken from a computer simulation of the freezing process.
Freezing gold nanocluster (movie)
Video of freezing gold nanocluster. This video was made with data obtained from a molecular dynamics simulation in which the motion of the system is followed atom by atom.
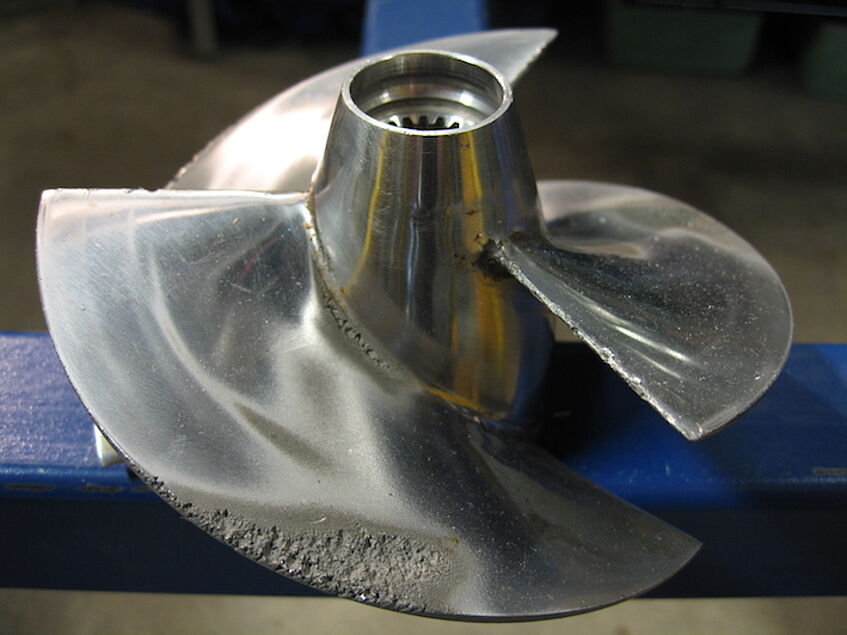
Cavitation (damage)
Propeller damaged by the effects of cavitation. When the pressure in water drops below the vapor pressure, small vapor bubbles can form, a process known as cavitation, which damages objects immersed in the fluid.
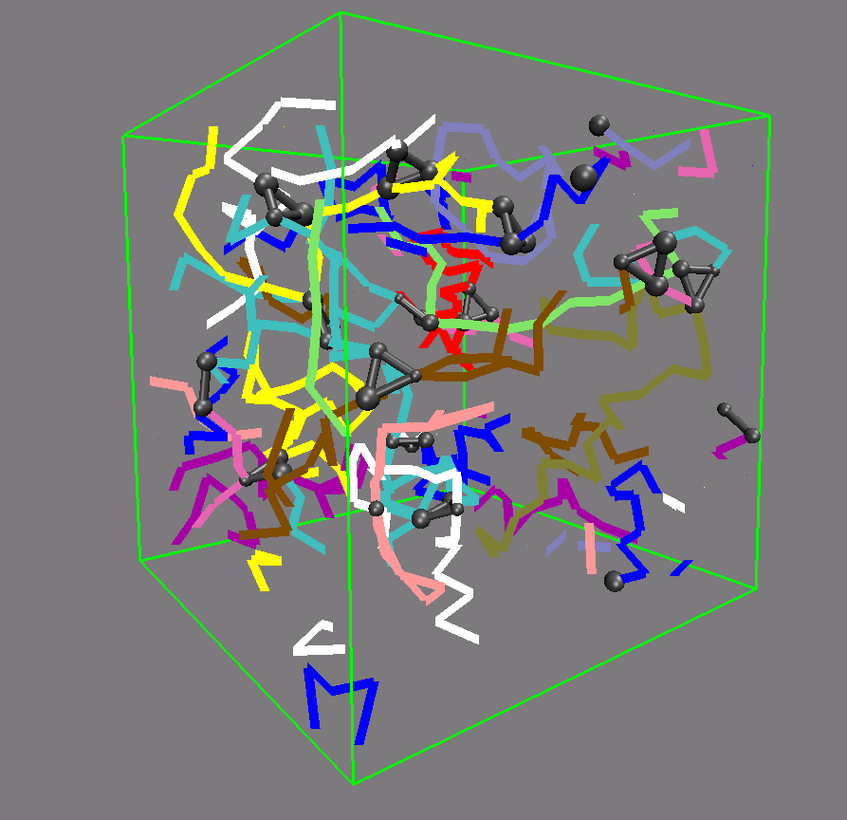
Polymer network
The picture shows a network made from differently colored polymers (spaghetti) that is held together by cross-links, made of three contacts. The cross-links are depicted by black balls and connecting bars. An important question to answer is how this network deforms, when one changes the size of the simulation box.
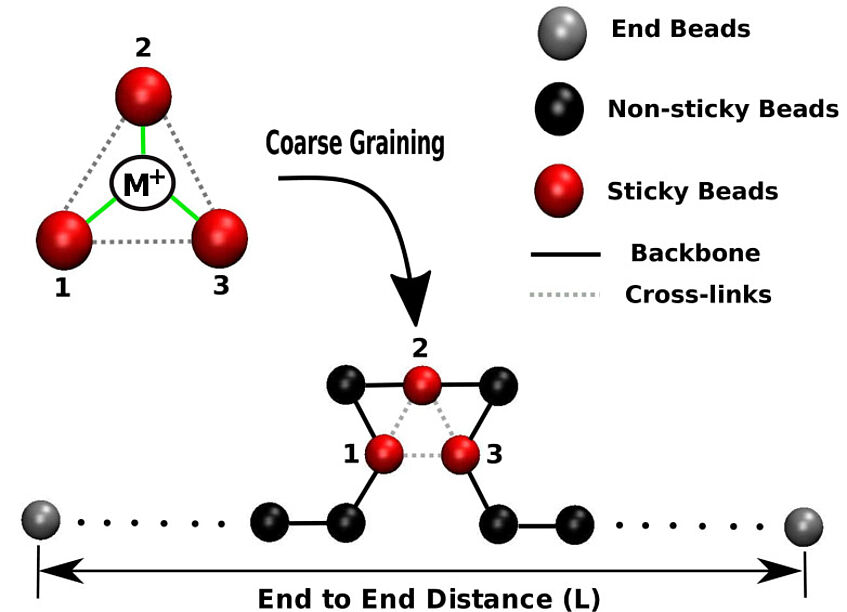
The model
The picture shows a schematic of cross-linking a single chain with a metal-ion. The ion cross-links three parts of one or of different polymers. The number of cross-links changes the mechanical behavior of the chain. Where the number of cross-links is large, the deformation is small and where the number of cross-links is low, the deformation is high.
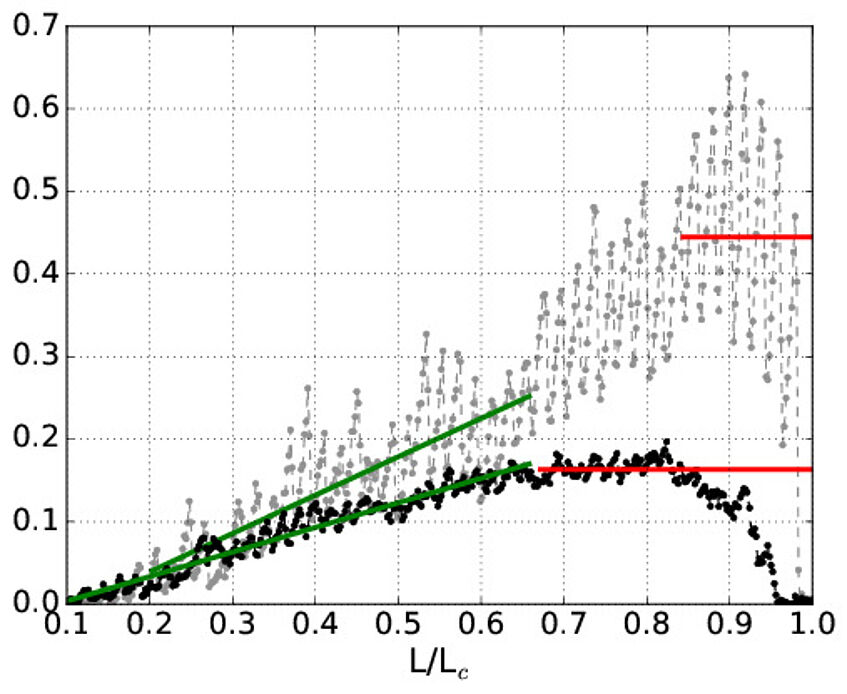
Displacement
Simulation of the force needed to pull different kinds of cross-linkes. The figure shows two polymers that have the same number of cross-links, but where the cross-links connects three parts of a polymer (black), or form solely between two partners (grey). The different mechanical behavior between the two different types is clear.
Trajectory (movie)
It shows the deformation of a polymer with exactly one cross-link that connects three parts of the polymer. This cross-link consists of three bonds. During deformation the bond connecting the two most distant parts of the polymer fails and soon a single remaining bond between two parts of the polymers forms.
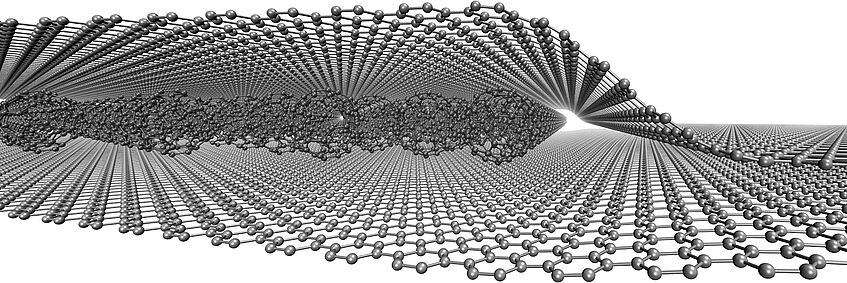
Breaking graphene
Defects, rather than the perfect lattice, determine the properties of any material. For example, materials always start to break at defects. Here is a computer simulation of a braking 2D layer of graphene.
Random walk
Image sequence showing a „hole“ in the graphene sample (two atoms are missing). The defect does not stay in one spot, but instead moves around during observation under the electron microscope. The defect performs a random walk driven by the irradiation.
Fullerene-Graphene sandwich
Fullerenes (the soccer-ball shaped molecules) were embedded between two graphene sheets and studied by atomic-resolution STEM. This way we could observe the diffusion and rotation of the molecules. Due to the motion of the fullerenes at the edge, they are only partially visible.
Structures under irradiation
Ordered structures can form under irradiation. In the video below these lines we can see how, through irradiation, a cluster of Si atoms (Silicon) forms.
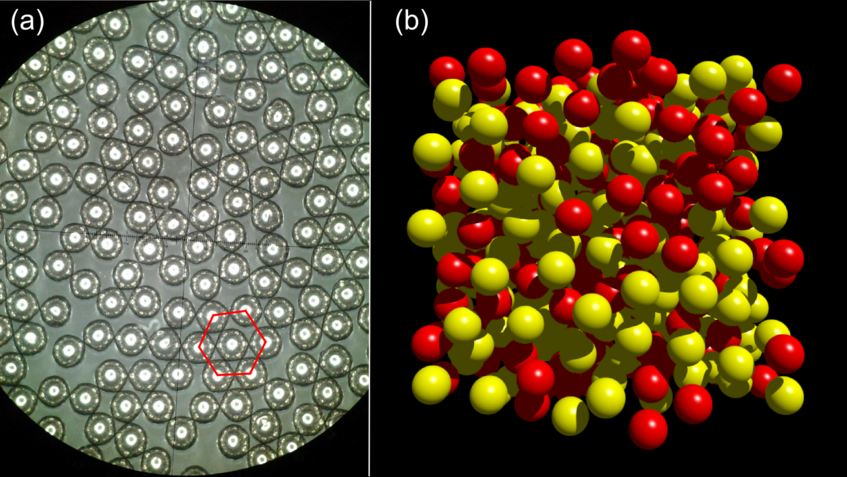
Order in disorder
The hexagon represents one densely packed 2-dimensional motif containing a central ball surrounded by 6 balls. In a metallic glass the atoms composing the material are disorderly arranged similar to balls in a bucket with some short-range order. The corresponding atomic structure is referred to as amorphous.
Nanodiff
The movie shows local diffraction images at different sample positions. The occurrence of speckles with high intensity in the diffraction pattern indicates the presence of special atomic clusters. The variation of the intensity between successive images is caused by the change of the local atomic structure when the beam is placed to a new sample position.
Variance plot
The plot shows the normalized variance as a function of the scattering vector k for a CuZr (Copper-zirconium alloy) base bulk metallic glass. The atomic structure of the clusters can be estimated by comparing the variance curve with peak positions of known crystalline structures, as indicated by the vertical lines.
![]()
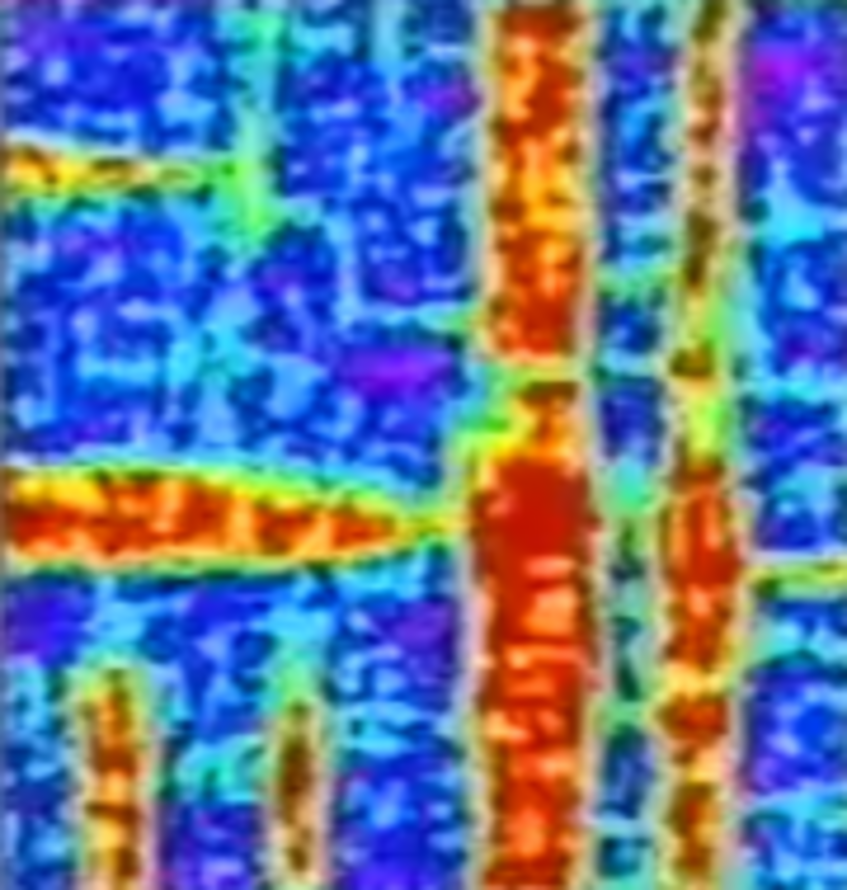
Local hardness
The image shows the variation of local hardness of a CuZr based bulk metallic glass after structural rejuvenation. Each spot represents the hardness value of a region of a few micrometres. Spots of blue colour correspond to regions of strongly reduced hardness whereas spots of red colour are the hardest regions.

Crackling noise
The simplest experiment for a system that produces crackling noise is to disrupt or crumple a piece of paper. The irregular movement of the crack front releases energy which is power-law distributed. This is very similar to the famous Gutenberg-Richter law in earthquakes.
MD Simulation
This is a very nice example of a molecular dynamic simulation of a molecular crystal (KSCN) showing the thermal fluctuations with heating above the critical temperature, and the evolution of domains (shown in different colors) and domain walls with cooling below that point.
Lead Zirconate
This movie was taken with an optical polarizing microscope during cooling a PbZrO3 crystal (lead zirconate) and shows the movement of domain walls. These domain walls display a different color as the surrounding material and might as well have completely different properties.
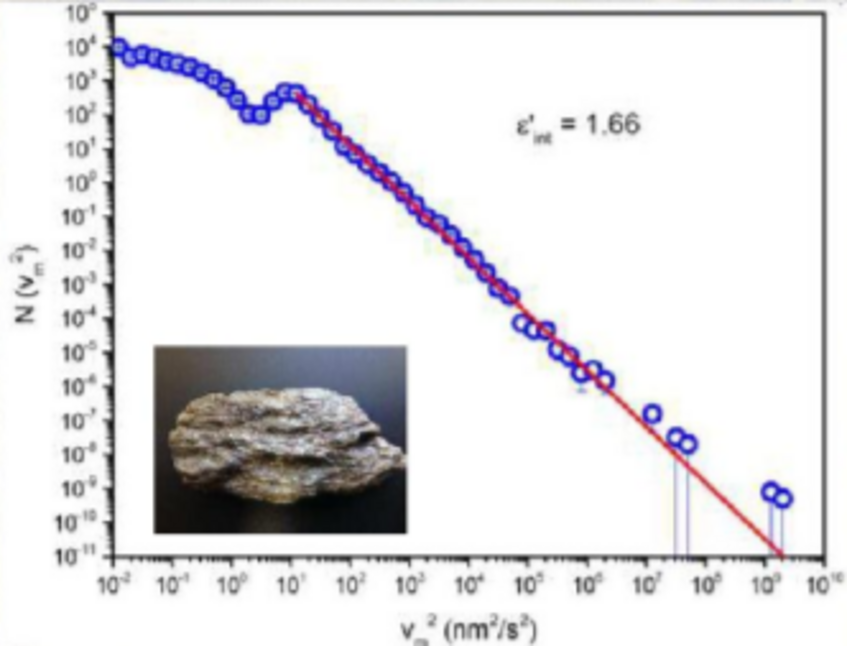
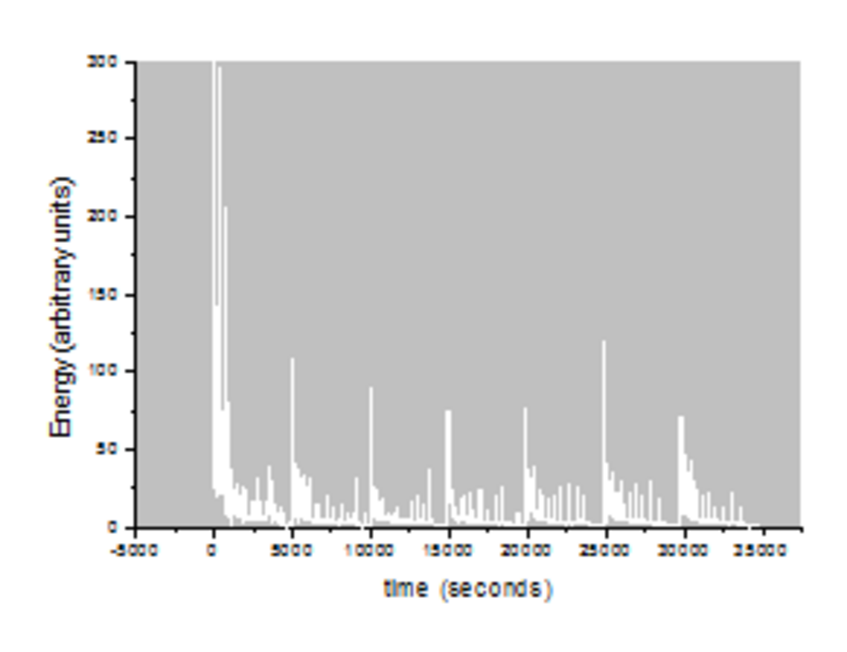
Data Schist & Schist energy with time (data)
This data files provided contain the energy distribution of a slow compression experiment performed on a mineral (schist from Großglockner) with time. Upon this data, the power-law distribution (shown in the picture above) was calculated.
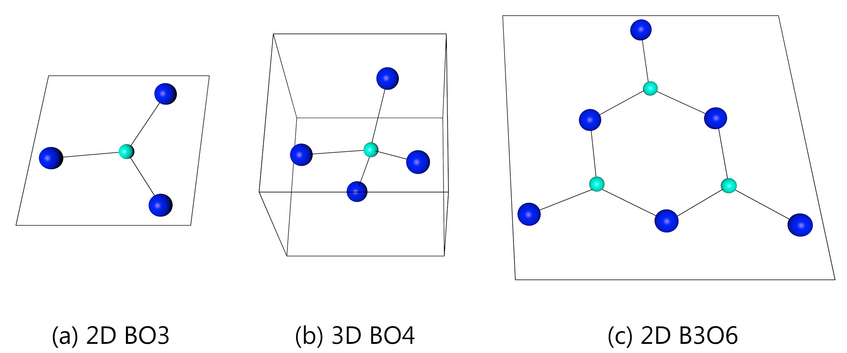
Borate structure
Alkali borate glasses show three main types arrangements in terms of structure: BO3 planar triangles (2-Dimensional); BO4 tetrahedrons(three-dimensional) as well as B3O6 boroxol rings (three positively charged boron atoms and three negative charged oxygen atoms forming a hexagonal ring). Each arrangement shows variations in density and conductivity which can be very helpful.
Inside alkali borate
The video shows the interior of an alkali borate glass sample. The ions are moving through the structure, whereas the structure itself is vibrating. The positive charged ion won't reside next to another positive ion, respectively next to a positive boron atom. Favoured are negative charged oxygen atoms. One should imagine the ionic motion more as jumps than fluent movements.
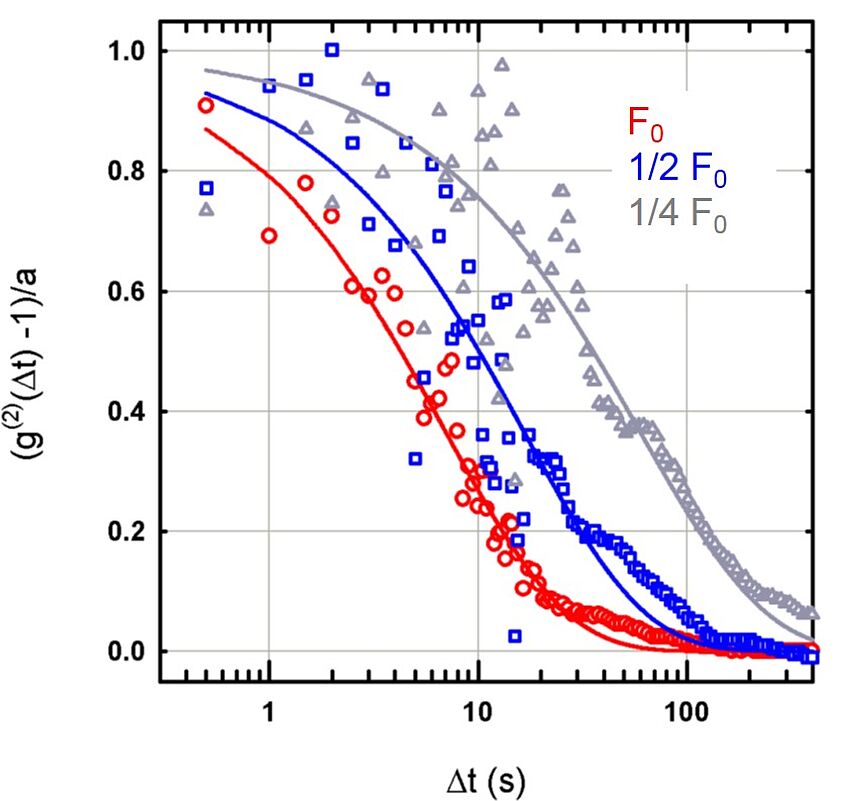
Correlation function
Here, a sample is 'bombarded' with a beam of electrons, with three different intensities (each one half of the previous one). The diffusion of the atoms, however, doesn't react as expected: you can see (logarithmically plotted) the decrease of the correlation function. The faster the decrease in time Δt, the faster the motion of the atoms.
Beam induced dynamics (video)
The video shows the difference between a beam-induced diffusion on the right and an intrinsic diffusion on the left of an alkali borate sample. We recently discovered that ion-conducting materials like alkali borate behave differently to the X-ray beam, which could help to indirectly investigate the bonding properties of these materials.